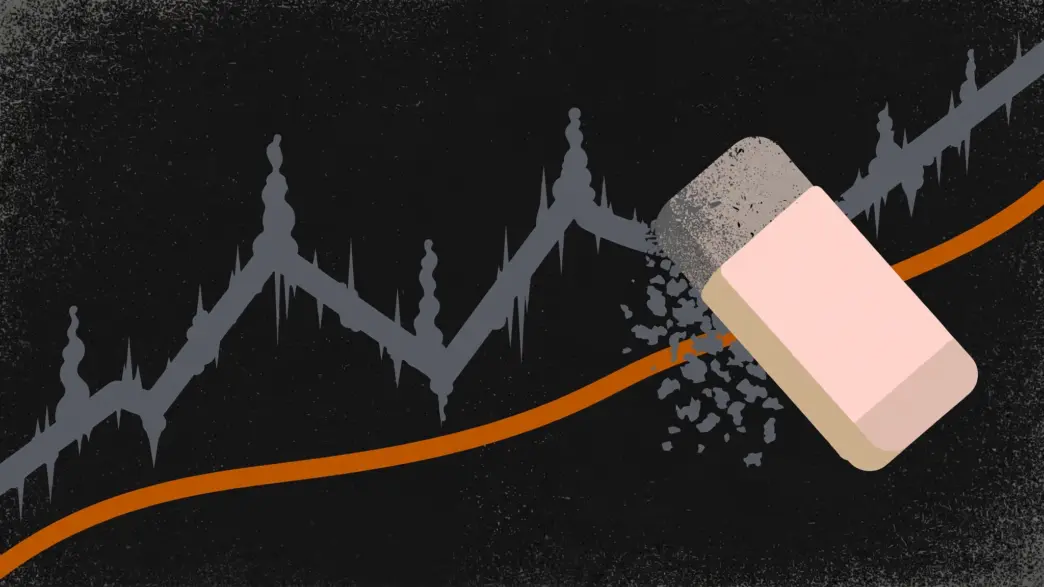
Bitcoin’s loudest years are easy to remember. The hard part is noticing that those years can make the next stretch look worse, not better.
That is the claim in a mid-September post from Sminston With, an engineer who publishes long-run Bitcoin models. Someone had argued that without bubbles, Bitcoin would not be worth owning because investors would miss the ‘epic gains.’ He tested the opposite idea: remove the bubbles, then measure the same four-year growth rates.
The result was the opposite of the usual story.
‘I removed ALL of the bubbles, as you know I’ve been doing with the Bubble-free power law. Then I measured the 4-year growth rate. WITH bubbles vs WITHOUT: 2017: 109% vs 137% / 2018: 84% vs 115% / 2021: 35% vs 72% / 2025: 17% vs 52% / Yes, you’re reading that correctly. Delete the bubbles and Bitcoin’s growth rate goes UP.’

Here's a counterintuitive Bitcoin FACT you probably haven't run into before😂👇
— Sminston With 👁 (@sminston_with) September 17, 2026
I recently saw someone claim that without Bitcoin's bubbles, it wouldn't be worth investing in since it would then miss out on all the epic gains.
So I removed ALL of the bubbles, as you know I've… pic.twitter.com/KCkdqqyv18
The 2025 line is the one that lands. The 17% figure is measured from the 2021 peak. Take that peak out of the record and the same window shows 52%. A mania inflates the ride up, then becomes a terrible starting point four years later.
‘A bubble inflates your return on the way in, then wrecks it four years later when that top becomes your starting point.’
His conclusion is blunt:
‘The manias were never where the gains came from. They’re noise on top of an asset that has compounded faster than anything on earth for a decade WITHOUT them… Stop planning around the bubbles, people. Plan around the orange line.’
He marked the post NFA. That still leaves a useful question: if the orange line is the thing that matters, what does a good entry look like after this?
What he actually removed
This is not a hand-drawn ‘ignore the parts I dislike’ chart. In a follow-up, he said bubble stretches were taken out of the dataset after a hidden Markov model labeled them as a different phase from ordinary trading. The point, in his words, was to get ‘a truer sense of relative value / fair value when running up / FOMO etc is not in the picture.’
The bubbles for bubble-free PL were excluded from the data entirely – in other words, a hidden Markov model defined what should be categorized as a bubble vs not bubble, since from my perspective they should be treated as different phases of the overall data. This gives us a…
— Sminston With 👁 (@sminston_with) September 16, 2026
The chart in his post makes the same argument visually. The top panel shows Bitcoin’s price with bubble days marked in red and those days replaced by a smoother ‘bubble-free fair value’ line. The bottom panel tracks trailing four-year growth. The white line, which includes every day, swings hard and often sits lower. The orange line, with bubble days replaced, is steadier and frequently higher.
That is the orange line he wants people to plan around: not a promise of next month’s price, but the path that remains after the spikes are treated as a separate regime.
Where price sat when he said this
Four days before the growth-rate post, he put a number on the model:
‘Forget the bubbles. At $77,200, the quantiles of the bubble-free power law… say we’re at about the 8.5th percentile.’
In early September he also wrote that the orange line itself was near $76,550. In June, after the drop, he was more extreme: at $59,800, his bubble-free support rainbow put Bitcoin at or slightly under the 0.2th percentile. ‘How much deeper can the beachball be pushed?’ he asked.
That June low shows up in the thread replies as well. SuperBitcoinBro listed calendar-year reference prices and argued that the way people usually lose is by chasing the spikes:
‘Funny because chasing bubbles is the only way people can screw it up. Bitcoin is a beast if you lock in anywhere near a yearly low and just hodl.’
His 2026 print on that list was $57,747.77. The rest of the list is a reminder of how violent the path has been: $0.05 in 2010, $28,722 in 2021, $15,599 in 2022, $74,436 in 2025.
Fred Krueger’s reply was short: ‘great work.’ The more interesting pushback came from Willy Woo, who did not dispute the math so much as the history:
‘IMO BTC wouldn’t have succeeded without bubbles. It was the advertising strategy for a nascent asset. It accelerated adoption and infrastructure build out. Dotcom bubble built a lot of the infrastructure we use today. Likely the same happening today in AI.’
A later reply in the same thread split the difference: speculative excess paid for the rails; the network outlasts the froth. That is a fair tension. Sminston is talking about how to measure and plan around returns. Woo is talking about how the asset got adopted in the first place. Both can be true at once.
What ‘ideal entry’ means in this framing
If the four-year math is worse when you start from a mania high, then a good entry is not ‘the day after a crash’ as a slogan, and it is not ‘the breakout everyone is already cheering.’ It is a price that sits on or under the bubble-free trend, while that trend itself is still rising.
By late September 2026, Bitcoin was trading near $83,000 — off the 2025 high above $126,000, above the June low near $58,000, and still in the cheaper half of the bands Sminston had been publishing. Separate long-run floor models around the same week put support near $61,000, with price about 1.35 times that floor.
In this framework, $83,000 is already a reasonable zone: not a beachball crushed to the 0.2th percentile, not a 2021-style top either. A later test of the mid-$60,000s or low $70,000s would be closer to the historically better accumulation area on his charts. Waiting for the next vertical spike would be doing the thing his table warns against.
The practical version of ‘plan around the orange line’ is unglamorous. Add over time while price is still tracking the underlying path. Do not treat the next mania as the source of the return. Do not treat a single print as the only acceptable buy.
The limit of the argument
The model has a good long record. An untouched 2013 spreadsheet fit is still near today’s price more than 13 years later, which Sminston called ‘Nostradamus territory’ and then immediately walked back to ‘real statistics on a unique network asset.’ That is the right tone. A line that has held is not a law of nature.
Bubbles may have been advertising, as Woo said. They may also have been the part of the record that later makes four-year returns look weaker. The post is useful because it separates those two ideas. Adoption and return measurement are not the same problem.
None of this is a forecast that Bitcoin must revisit $60,000, and none of it is a recommendation to buy. Price can still fall. The author’s own label still applies: NFA. The useful residue is narrower than a price target. If the gains were never mainly in the balloons, the work is to keep buying the tree.
Sources
- Sminston With: the 4-year growth rate with bubbles removed (Sep 17, 2026)
- Sminston With: the bubble-exclusion methodology, hidden Markov model (Sep 16, 2026)
- Sminston With: “Forget the bubbles,” $77,200 and the 8.5th percentile (Sep 13, 2026)
- Sminston With: the orange line at $76,550 (Sep 1, 2026)
- Sminston With: bubble-free support rainbow at $59,800 (Jun 26, 2026)
- Sminston With: the 2013 spreadsheet fit, “Nostradamus territory” (Sep 27, 2026)
- SuperBitcoinBro: reply on chasing bubbles and yearly lows
- Willy Woo: reply on bubbles as adoption advertising