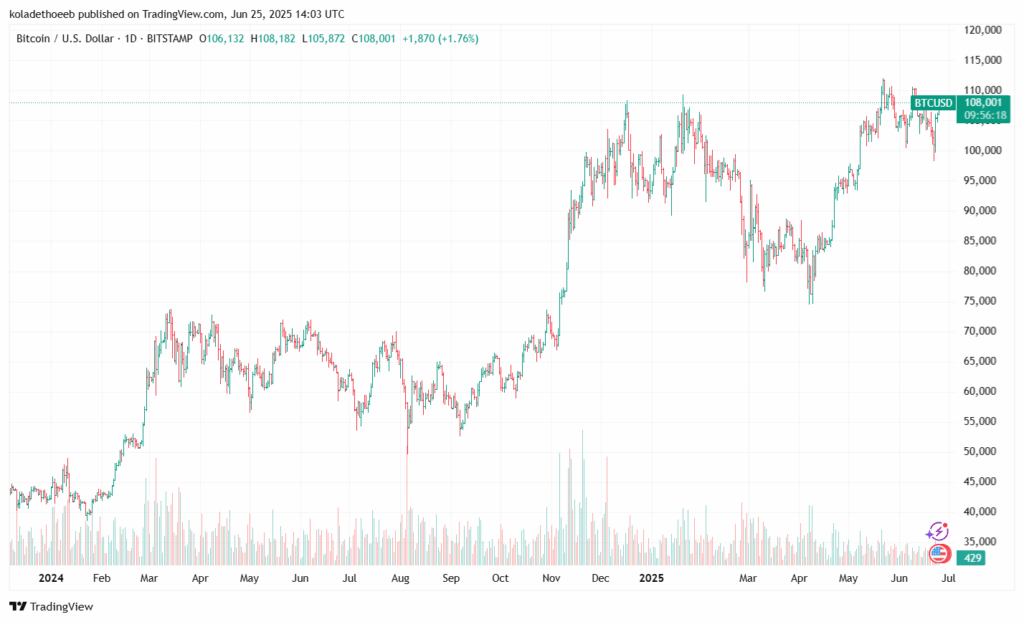
Bitcoin shows a short-term bull trend on the 1-hour and 4-hour charts, rising from a June low point of $99,000 to $107,213, with higher highs and lows. The 4-hour chart shows consolidation near $108,500, suggesting potential forward momentum.

On the daily chart, a 76% increase from $60,864 in June 2024 to current levels is in line with a sustained long-term bull trend, despite a volatile June dip below $99,000. The weekly chart supports this trend, with higher lows close to $80,000 in late 2024.
An upward trendline on the daily chart, near $102,000, connects lows from November 2024 and June 2025, while a falling resistance trendline on the 4-hour chart, around $108,500, limits increase.
A bullish flag pattern on the 4-hour chart and an ascending triangle on the daily chart point toward potential breakouts to $112,000–$115,000. Candlestick patterns, including a bullish pin bar at $99,000 on June 15 and a bullish overtake candle on June 20, show buying pressure.
RSI and MACD Back Bitcoin’s Bullish Momentum
The 14-period Relative Strength Index (RSI) shows a bullish strength, registering 62 on the 1-hour chart, 65 on the 4-hour chart, and 68 on the daily chart, just short of overbought levels. The June decline was supported by a bullish divergence on the 4-hour chart.
The MACD (12, 26, 9) remains positive, with a June 18 crossover on the 4-hour and positive histograms, though flattening signals suggest declining momentum.
Bitcoin is also above the 9-EMA at $106,800 and the 20-EMA at $106,500 on the 1-hour chart and the 50-SMA at $100,500 on the daily chart, which all confirm a bullish sentiment.
A golden cross of the 50-SMA over the 200-SMA in late 2024 confirms the long-term bull trend. Bollinger Bands (20, ±2σ) show the price near the top band—$107,500 on 1-hour, $108,000 on 4-hour—with rising bands showing rising volatility and likely breakout or pullback.
Key Levels: Bitcoin Eyes $110K as $102K Holds Firm
Strong support levels include $102,000 and $103,000, in line with the upward trendline and a horizontal zone, with secondary support at $95,000 and $97,000.
Resistance levels are around $110,000 and $108,500, supporting recent swing highs, with $115,000 as a psychological threshold.
The Trading volume surged during the June recovery, with $46.69 billion in daily volume as of June 25, 2025. On-chain data from DeFiLlama, including $1.63 million in DEX volume and $678,515 in fees, confirms the network activity.
A -0.89% change in Total Value Locked (TVL) to $6.363 billion is an indicator of minor profit-taking, but strong volume supports the uptrend.
Bitcoin’s Next Stop: $115K Breakout or a $104K Pullback?
Bitcoin’s short-term bullish momentum faces consolidation risks at $108,500–$110,000, with a possible pullback to $104,500–$105,000, close to the 20-EMA.
The mid-term perspective remains bullish, largely inspired by the ascending triangle and institutional interest.
There have also been reports noting Bitcoin’s resilience at a time of increased geopolitical tensions, though analyst predictions remain different, with PlanB projecting $250,000–$1 million and Elliott Wave analysis warning of a drop to $94,000.
Potential entry points are above $108,500 for a breakout or near $104,500 for a pullback. As profit targets are set at $110,000, $112,000, $115,000, $120,000, and $125,000 for longer-term positions. With stop-loss levels below $105,000 or $102,000 offer risk-reward ratios of 1:2 to 1:4.5.
A breakout above $108,500 with strong volume could confirm bullish continuation, while a decline below $102,000 would mean possible bearish risks. Bitcoin’s technicals and fundamentals favor a price surge, but traders are advised to monitor the movements and key levels.


